SPORT POSTS19 GRAPHICS

FANTASY DRAFT
GRAPHICS

Tap the caption to copy it. COPY ALT copies the alt text. POSTED files a card away at the bottom. Posts run on an archive of 49,108 mock drafts, 2010-2025. TOOL cards run on this year’s daily market capture, ship no caption, and are read at the draft table rather than posted.
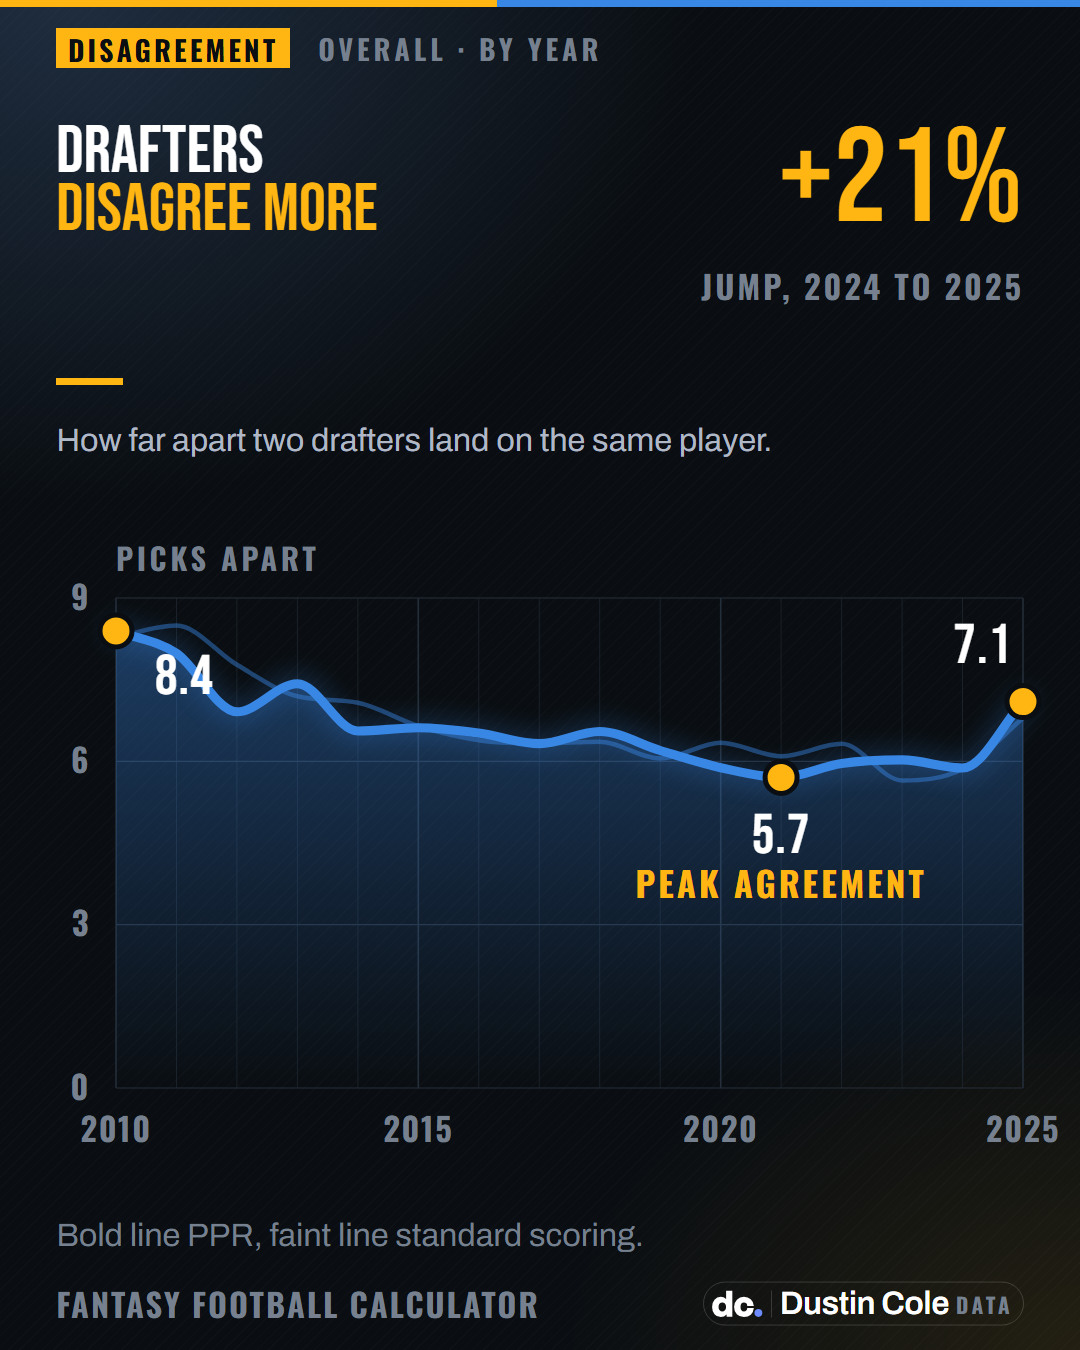
Line chart of fantasy draft disagreement from 2010 to 2025, falling from 8.4 picks apart to 5.7 in 2021 then rising to 7.1 in 2025.
01 / 19

DRAFTERS DISAGREE MORE

CAPTION · 162 CHARACTERS
Two drafters landed 8.4 picks apart on the same player in 2010 and 5.7 apart in 2021. In 2025 it is 7.1, up 21 percent in one year. 49,108 mock drafts, 2010-2025.
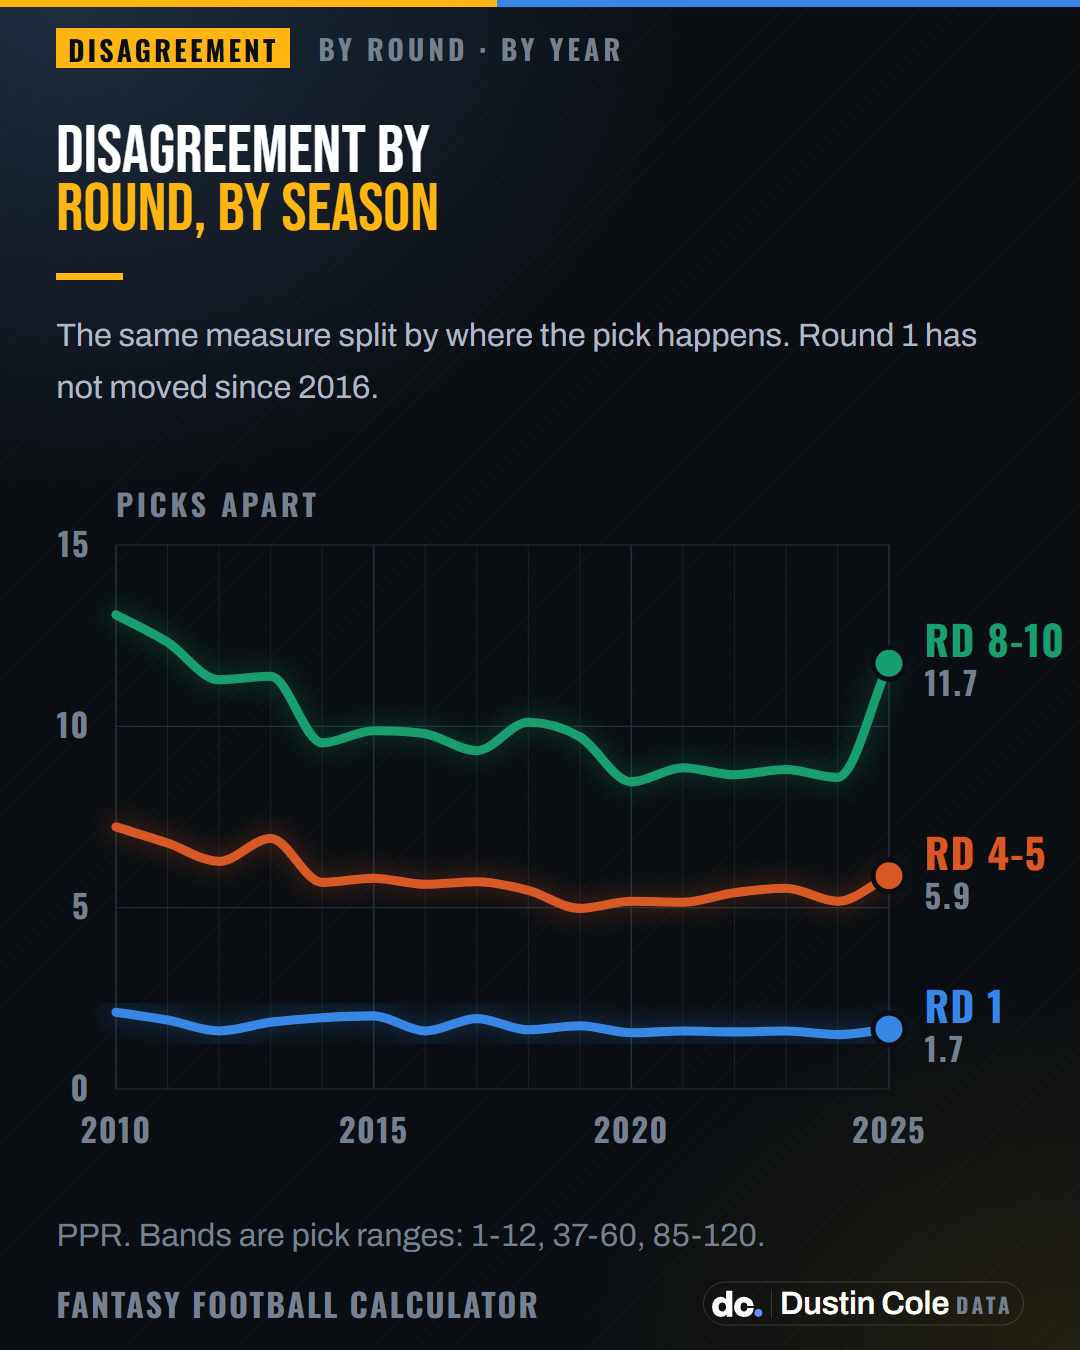
Line chart of fantasy draft disagreement by round from 2010 to 2025. Round 1 is flat near 1.7 picks apart while rounds 8 to 10 jump to 11.7 in 2025.
02 / 19

DISAGREEMENT BY ROUND, BY SEASON

CAPTION · 182 CHARACTERS
In 2025 two drafters land 1.7 picks apart on a first-round player and 11.7 apart on one taken in rounds 8 through 10. Round 1 has not moved since 2016. 49,108 mock drafts, 2010-2025.
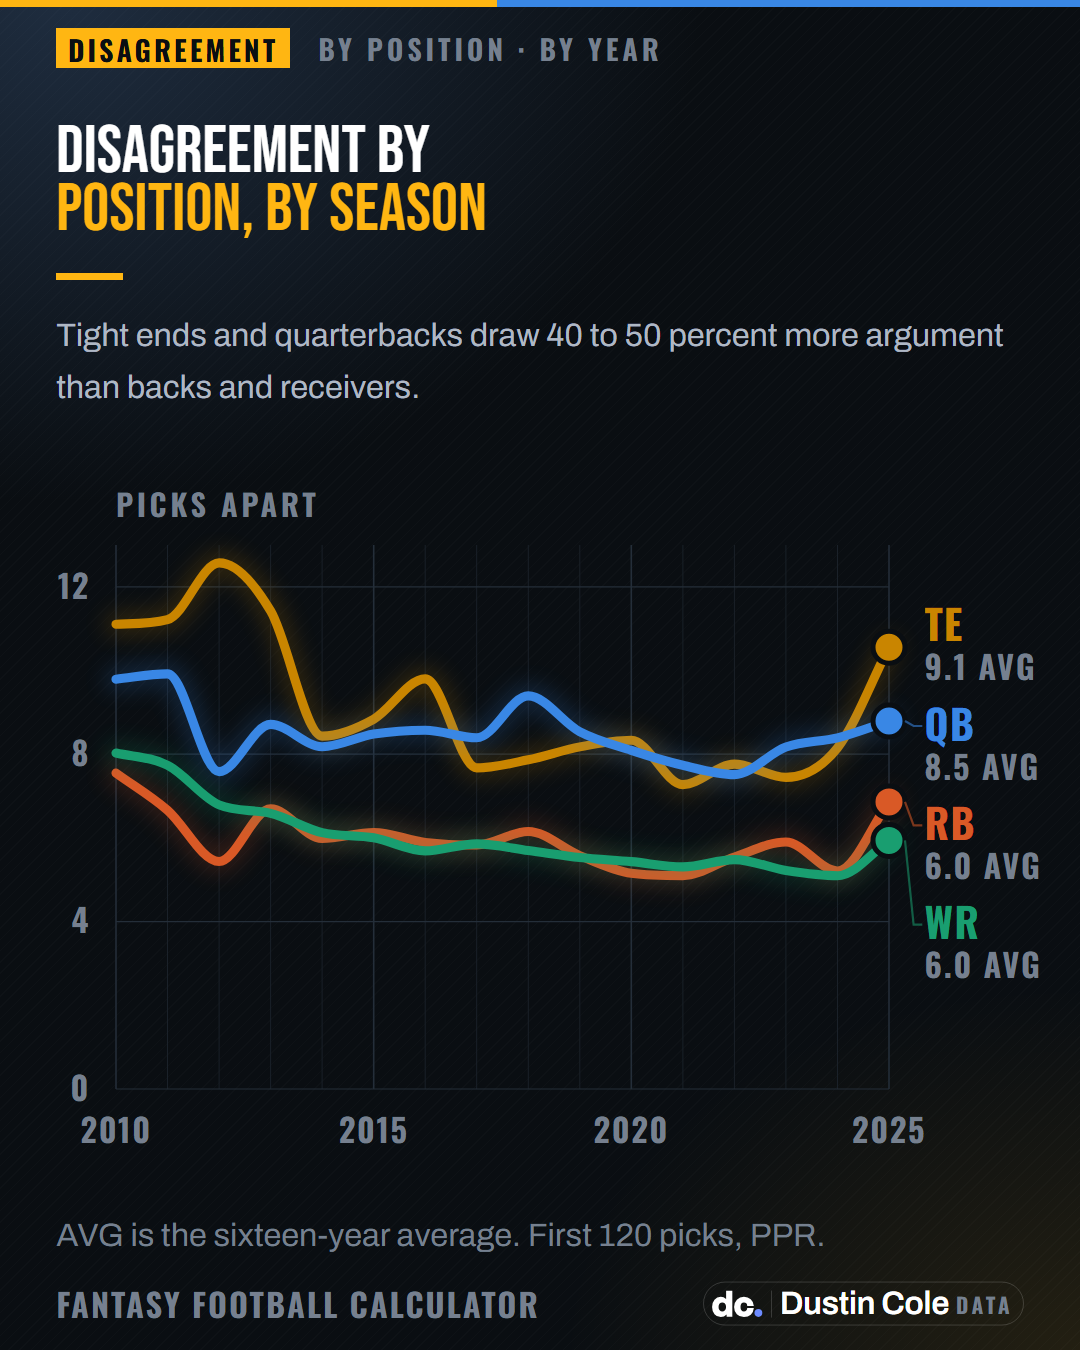
Line chart of fantasy draft disagreement by position, 2010 to 2025. Tight end averages 9.1 picks apart and quarterback 8.5, against 6.0 for running back and receiver.
03 / 19

DISAGREEMENT BY POSITION, BY SEASON

CAPTION · 193 CHARACTERS
Tight ends draw 9.1 picks of disagreement and quarterbacks 8.5, against 6.0 for running backs and 6.0 for receivers. The order is the same in all sixteen seasons. 49,108 mock drafts, 2010-2025.
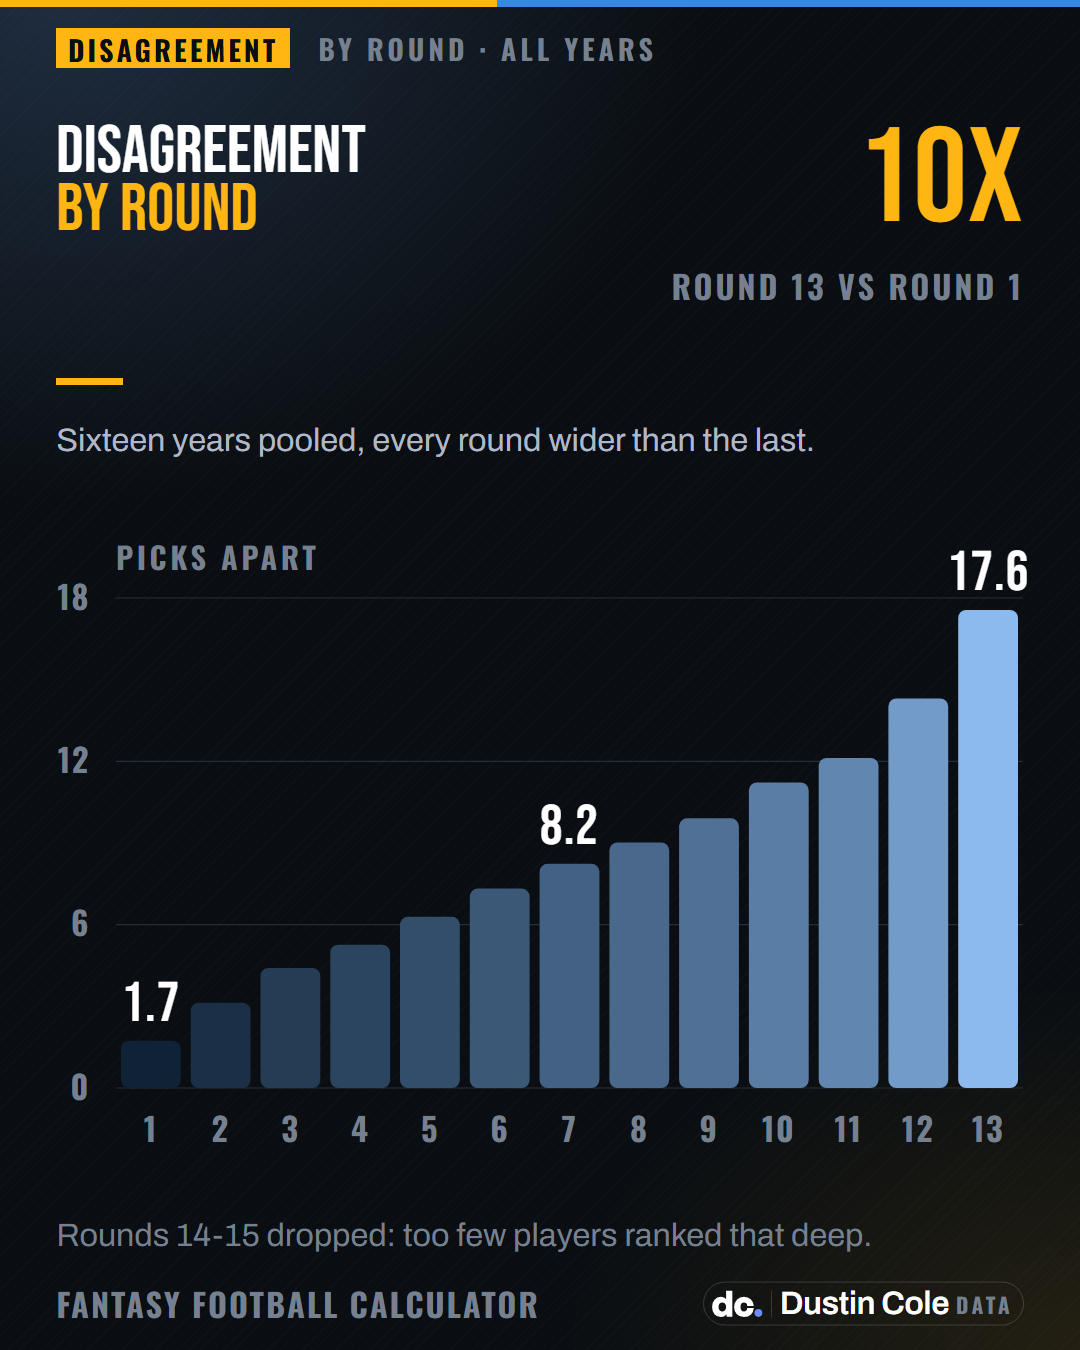
Bar chart of fantasy draft disagreement by round, pooled 2010 to 2025. It rises from 1.7 picks apart in round 1 to 17.6 in round 13, with no reversals.
04 / 19

DISAGREEMENT BY ROUND

CAPTION · 161 CHARACTERS
Round 1 splits two drafters by 1.7 picks and round 13 splits them by 17.6. Every round in between is wider than the one before it. 49,108 mock drafts, 2010-2025.
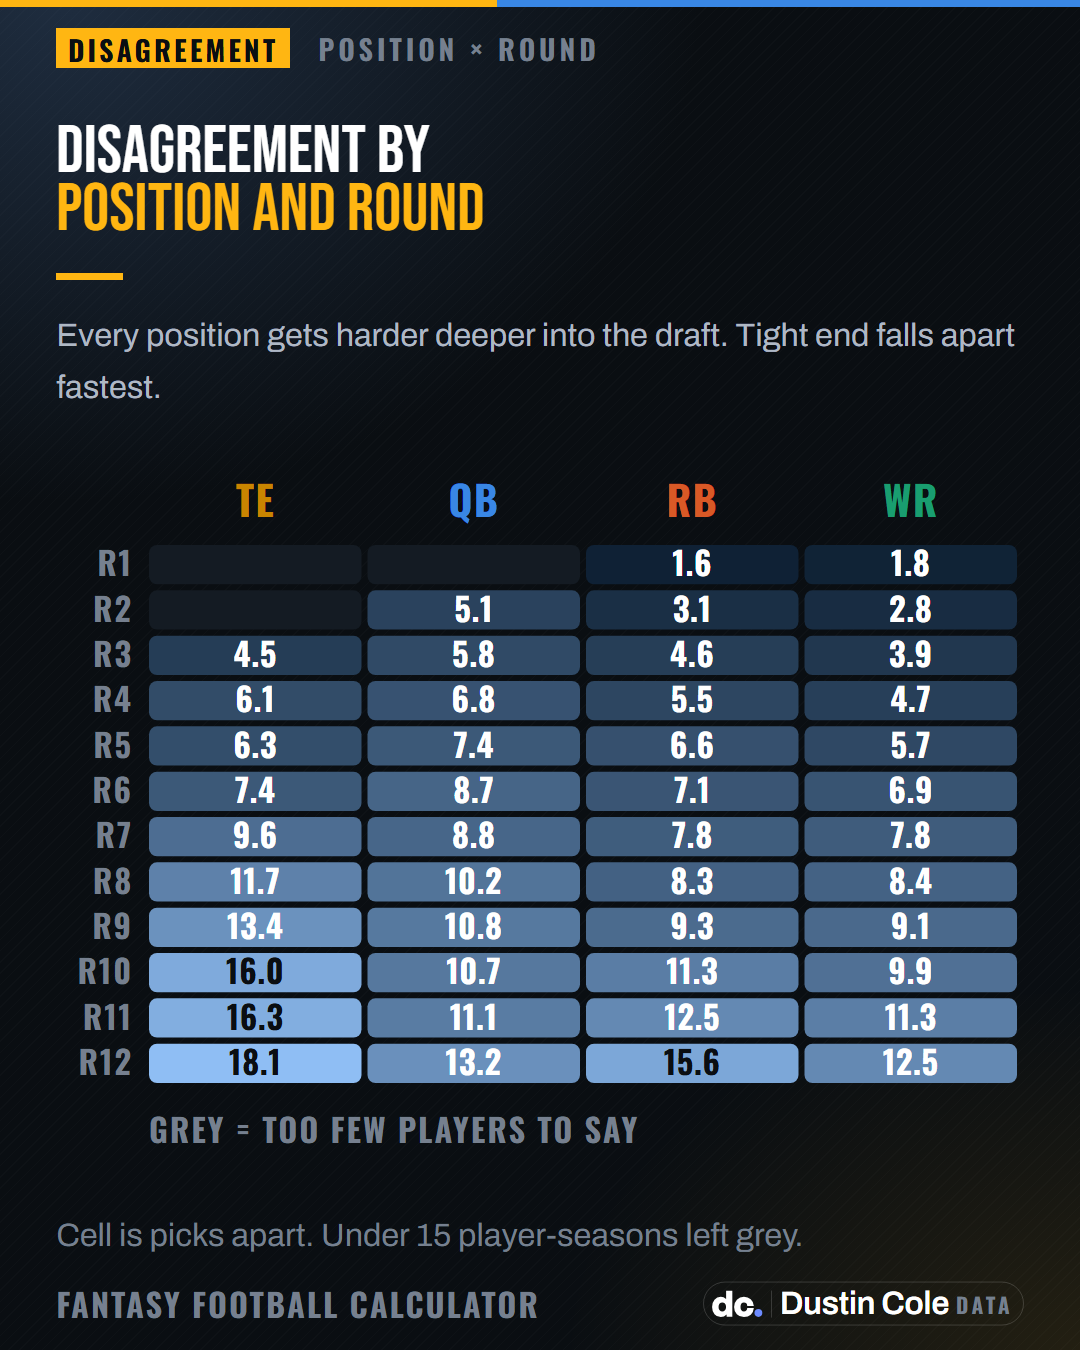
Heatmap of fantasy draft disagreement by position and round. Tight end rises from 4.5 picks apart in round 3 to 18.1 in round 12, the steepest of any position.
05 / 19

DISAGREEMENT BY POSITION AND ROUND

CAPTION · 170 CHARACTERS
A twelfth-round tight end splits two drafters by 18.1 picks, the widest cell on the board. In round 3 the same position splits them by 4.5. 49,108 mock drafts, 2010-2025.
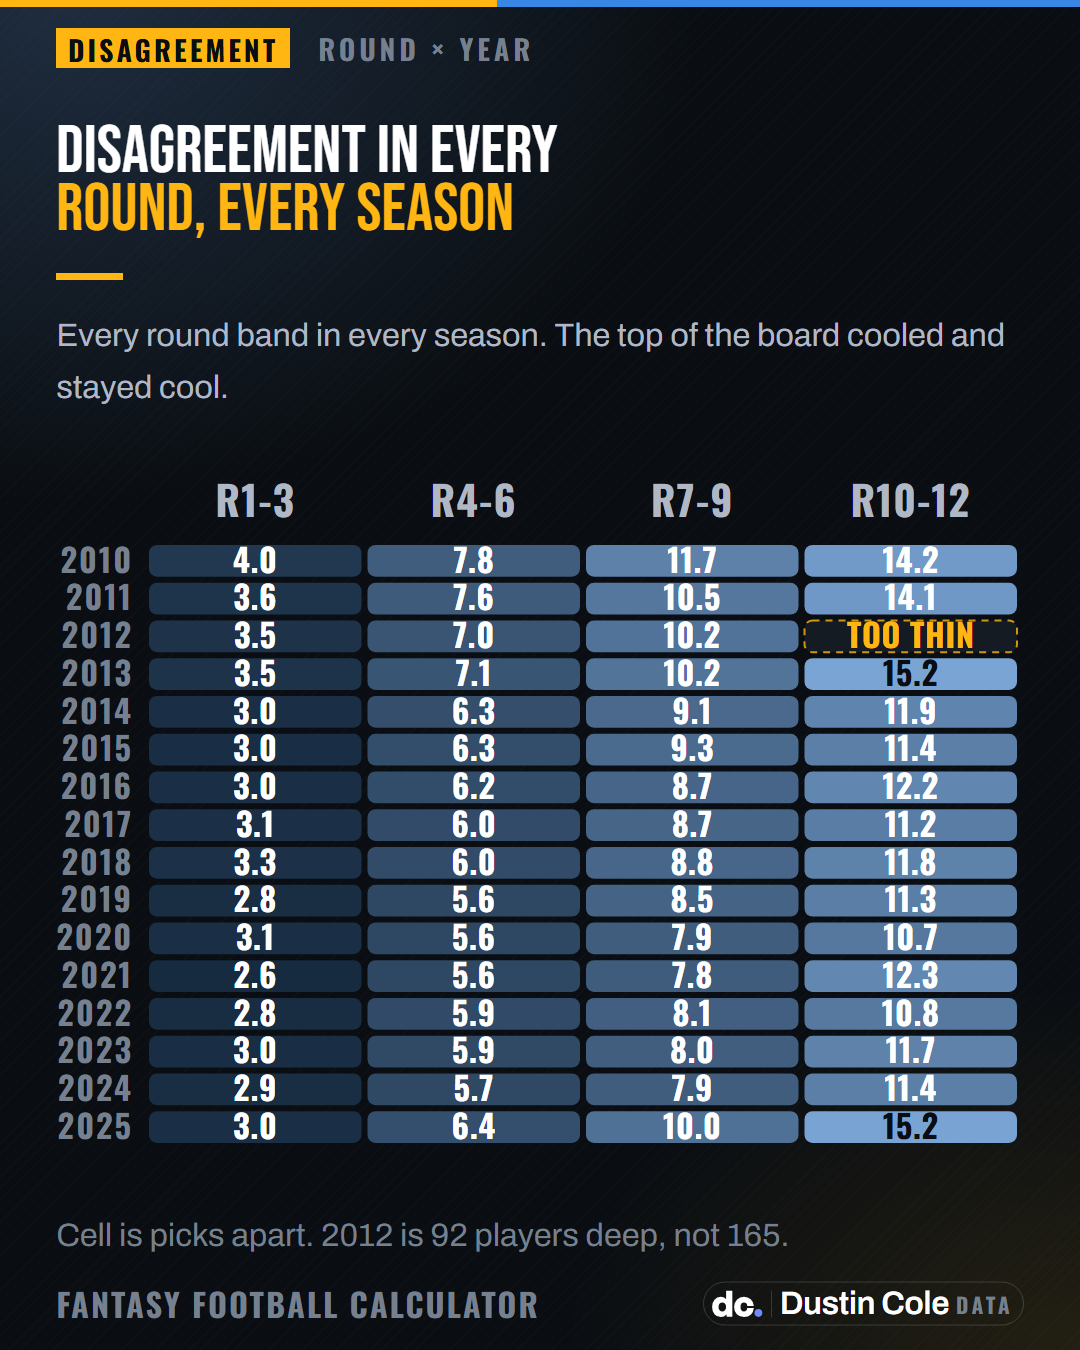
Heatmap of fantasy draft disagreement for every three-round band in every season from 2010 to 2025. The first three rounds stay tight throughout while rounds 10 to 12 brighten sharply in 2025. The last band of 2012 is blank because that season is only 92 players deep.
06 / 19

DISAGREEMENT IN EVERY ROUND, EVERY SEASON

CAPTION · 144 CHARACTERS
Rounds 1 through 3 have stayed between 2.6 and 3.3 picks apart since 2016. Rounds 10 through 12 in 2025 are 15.2. 49,108 mock drafts, 2010-2025.
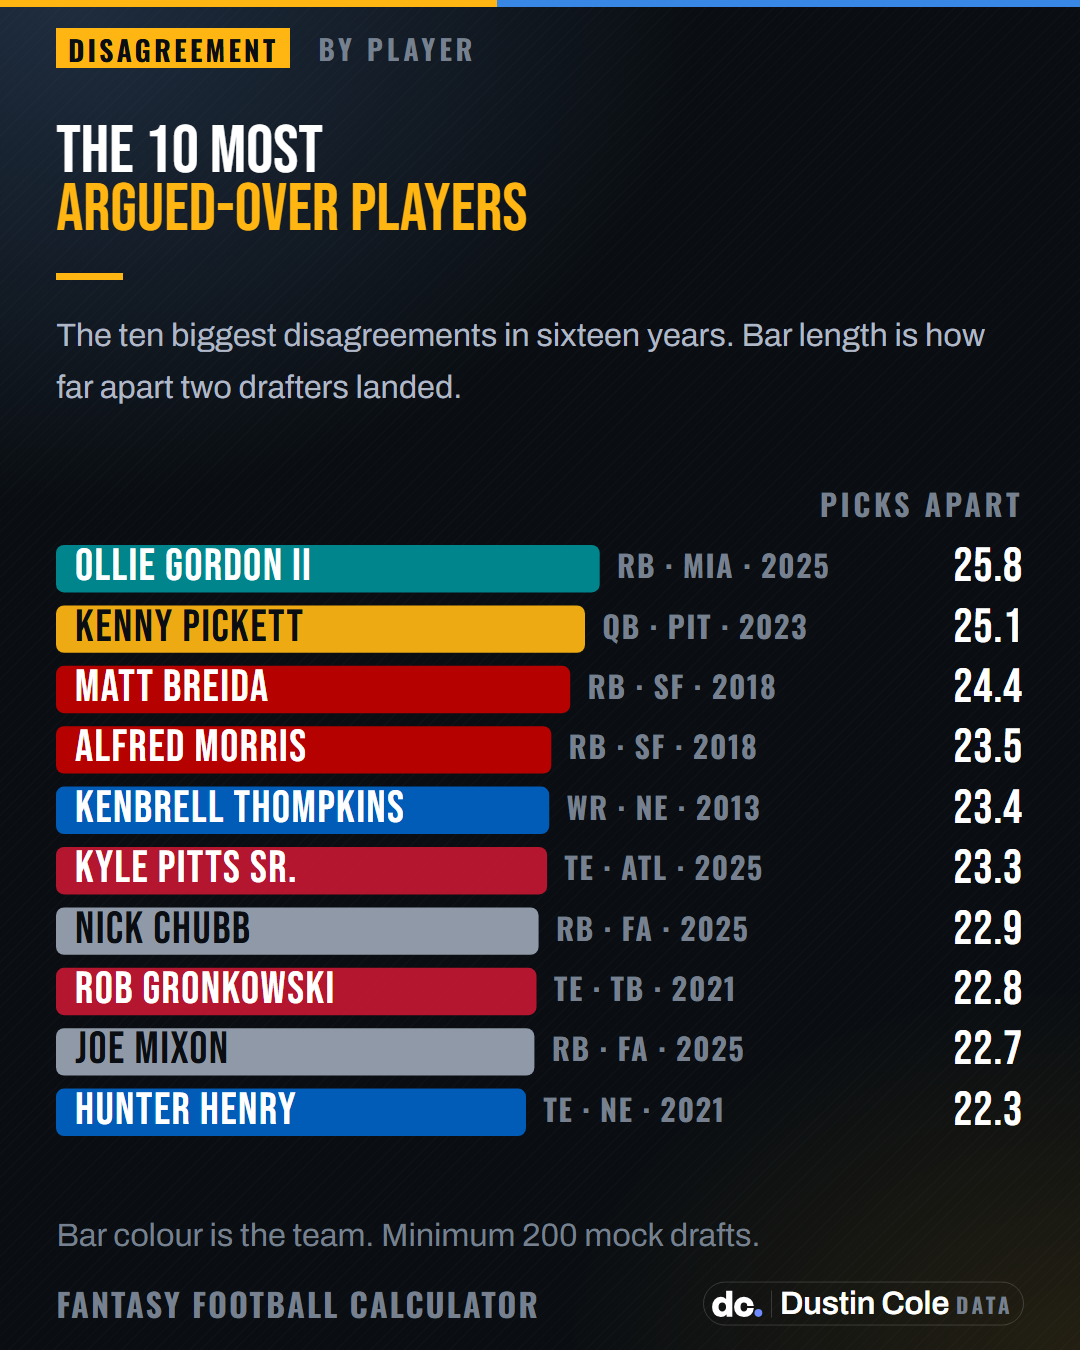
Bar chart of the ten most argued about fantasy players since 2010, led by Ollie Gordon II (RB, MIA, 2025) at 25.8 picks apart.
07 / 19

THE 10 MOST ARGUED-OVER PLAYERS

CAPTION · 179 CHARACTERS
The widest disagreement in sixteen years is Ollie Gordon II in 2025, at 25.8 picks apart across 239 drafts. Kenny Pickett in 2023 is second at 25.1. 49,108 mock drafts, 2010-2025.
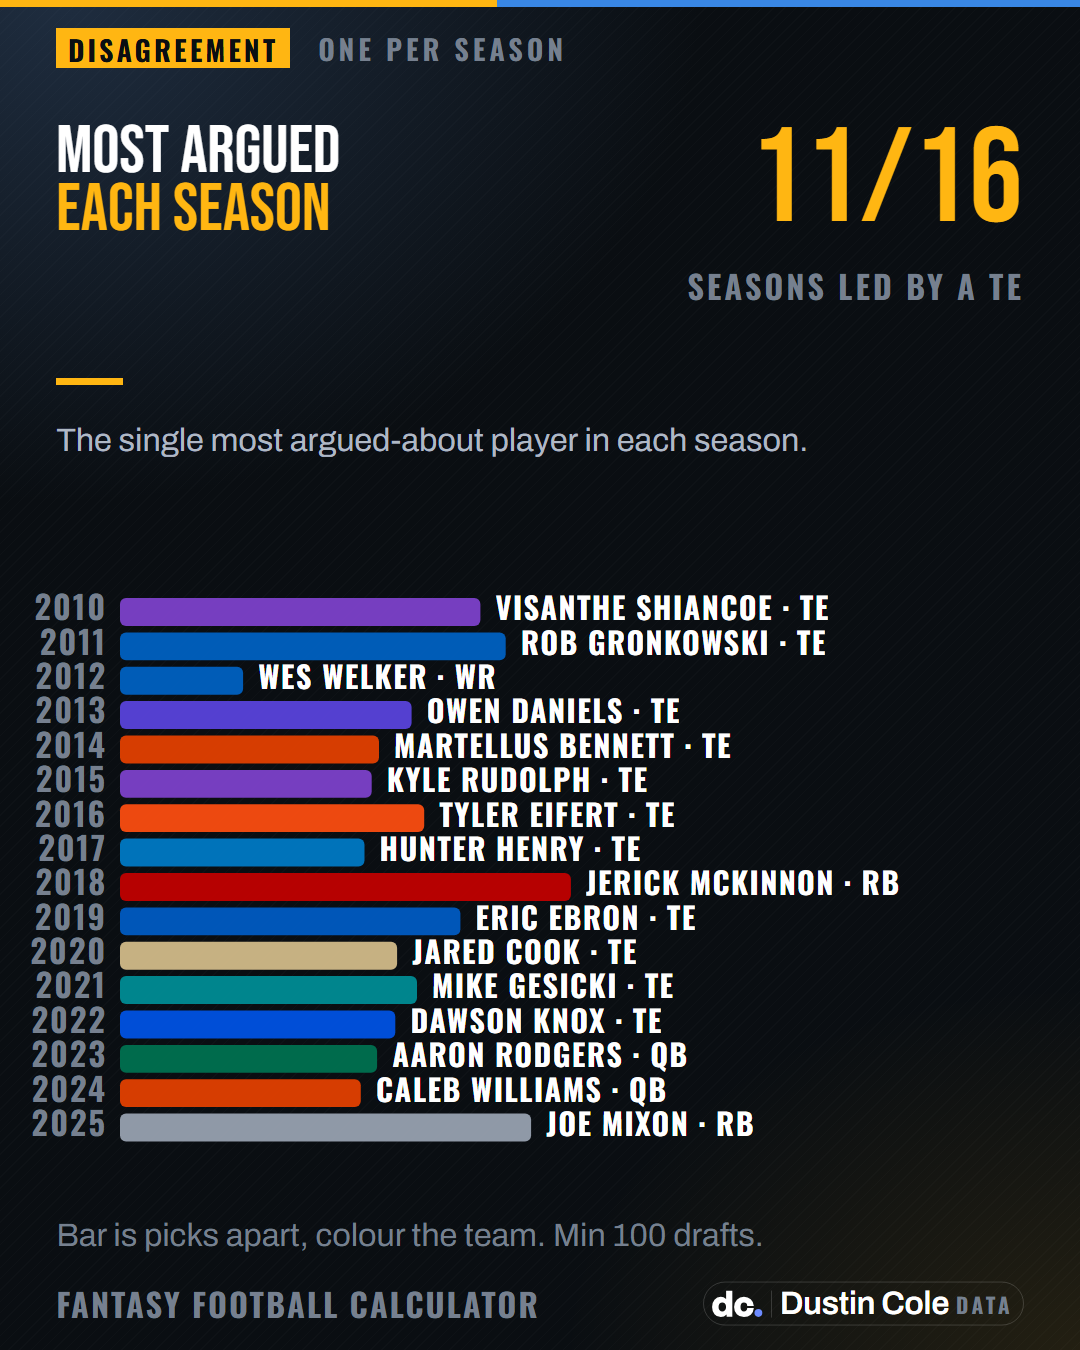
Chart naming the most argued about fantasy player in each season from 2010 to 2025. 11 of the 16 are tight ends.
08 / 19

MOST ARGUED EACH SEASON

CAPTION · 137 CHARACTERS
A tight end is the most argued-over player in 11 of the 16 seasons. No other position takes more than two. 49,108 mock drafts, 2010-2025.
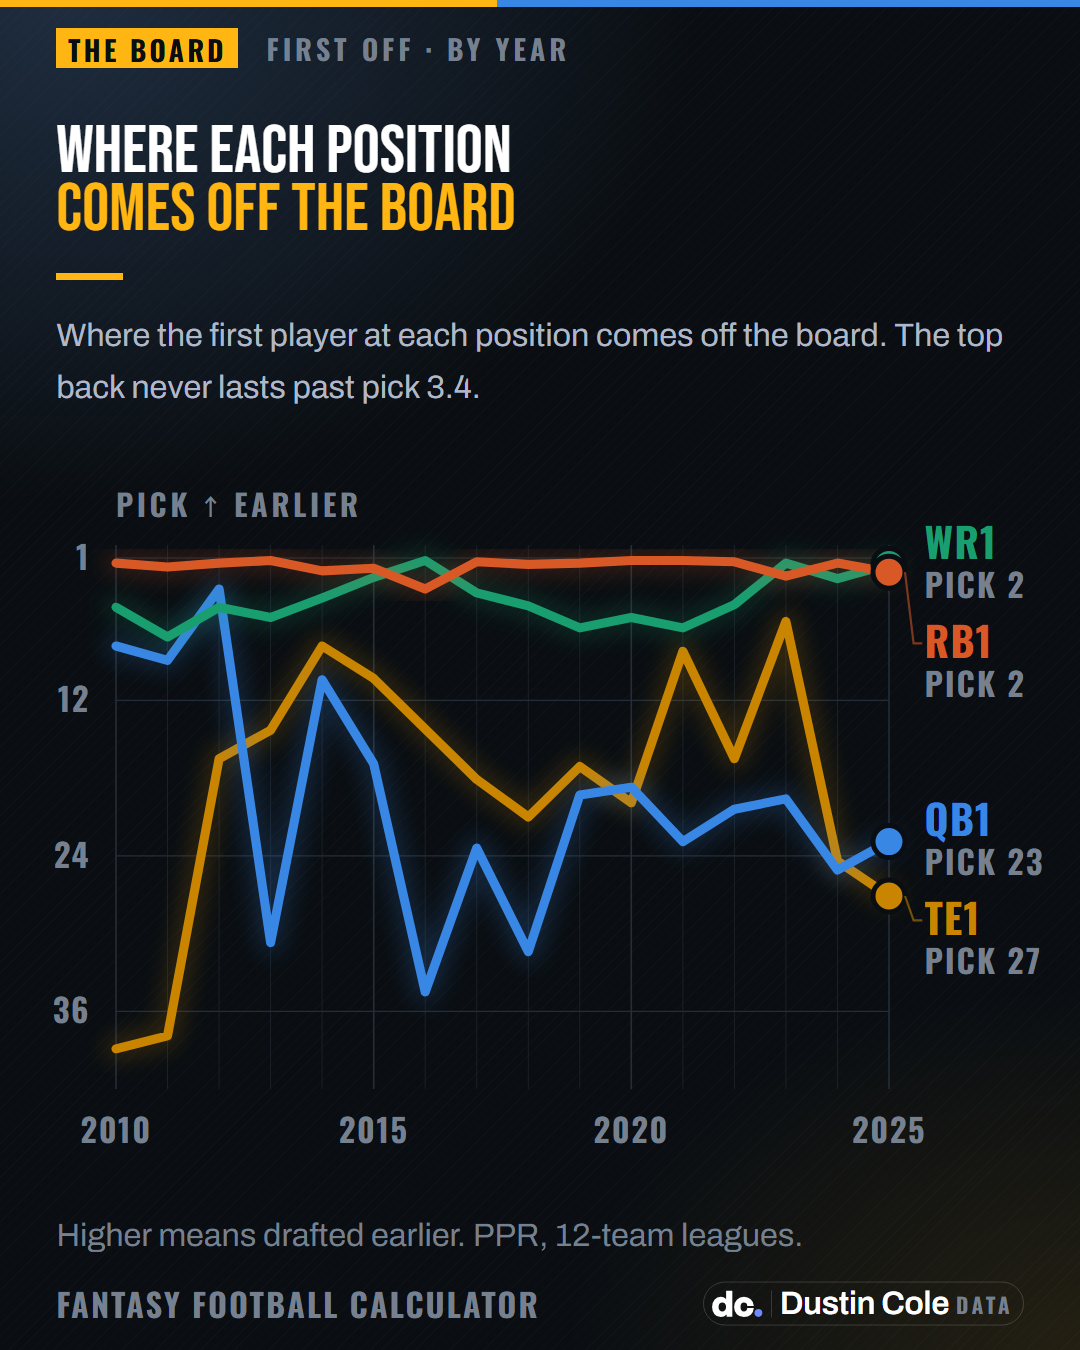
Line chart of where the first player at each position is drafted, 2010 to 2025. The first running back always goes by pick 3.4 while the first tight end ranges from pick 6 to 39.
09 / 19

WHERE EACH POSITION COMES OFF THE BOARD

CAPTION · 182 CHARACTERS
The first running back off the board has never lasted past pick 3.4. The first tight end has gone anywhere from pick 6 to pick 39. Same sixteen drafts. 49,108 mock drafts, 2010-2025.
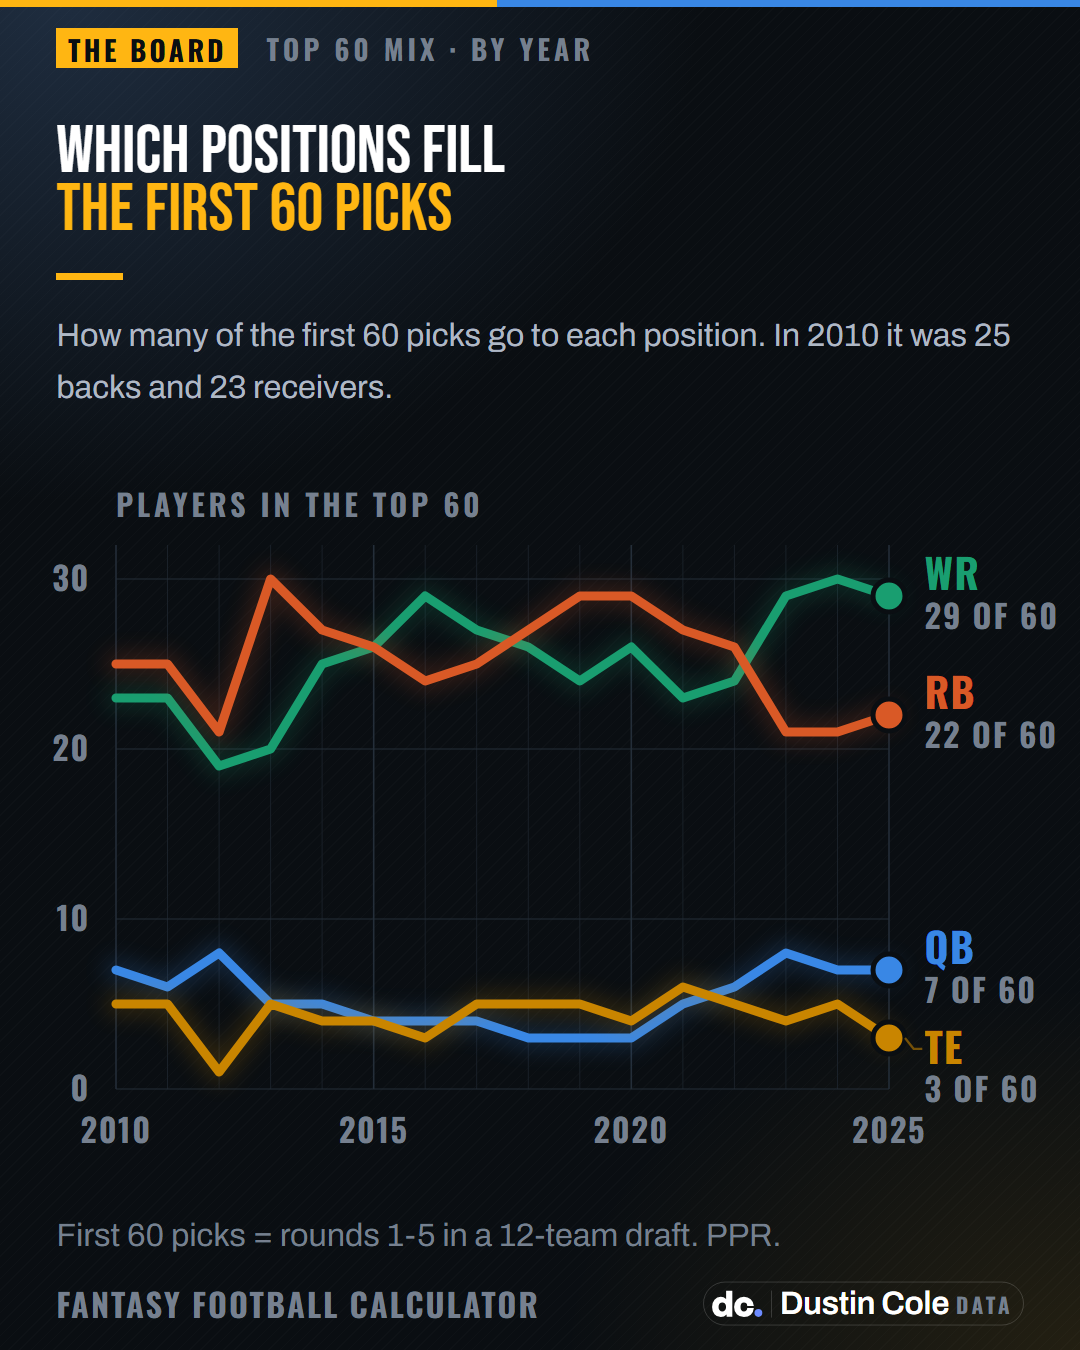
Line chart of how many of the first 60 fantasy picks go to each position. Receivers rise from 23 in 2010 to 30 in 2024 while running backs fall from 25 to 21.
10 / 19

WHICH POSITIONS FILL THE FIRST 60 PICKS

CAPTION · 147 CHARACTERS
In 2010, 25 of the first 60 picks were running backs and 23 were receivers. In 2025: 22 running backs, 29 receivers. 49,108 mock drafts, 2010-2025.
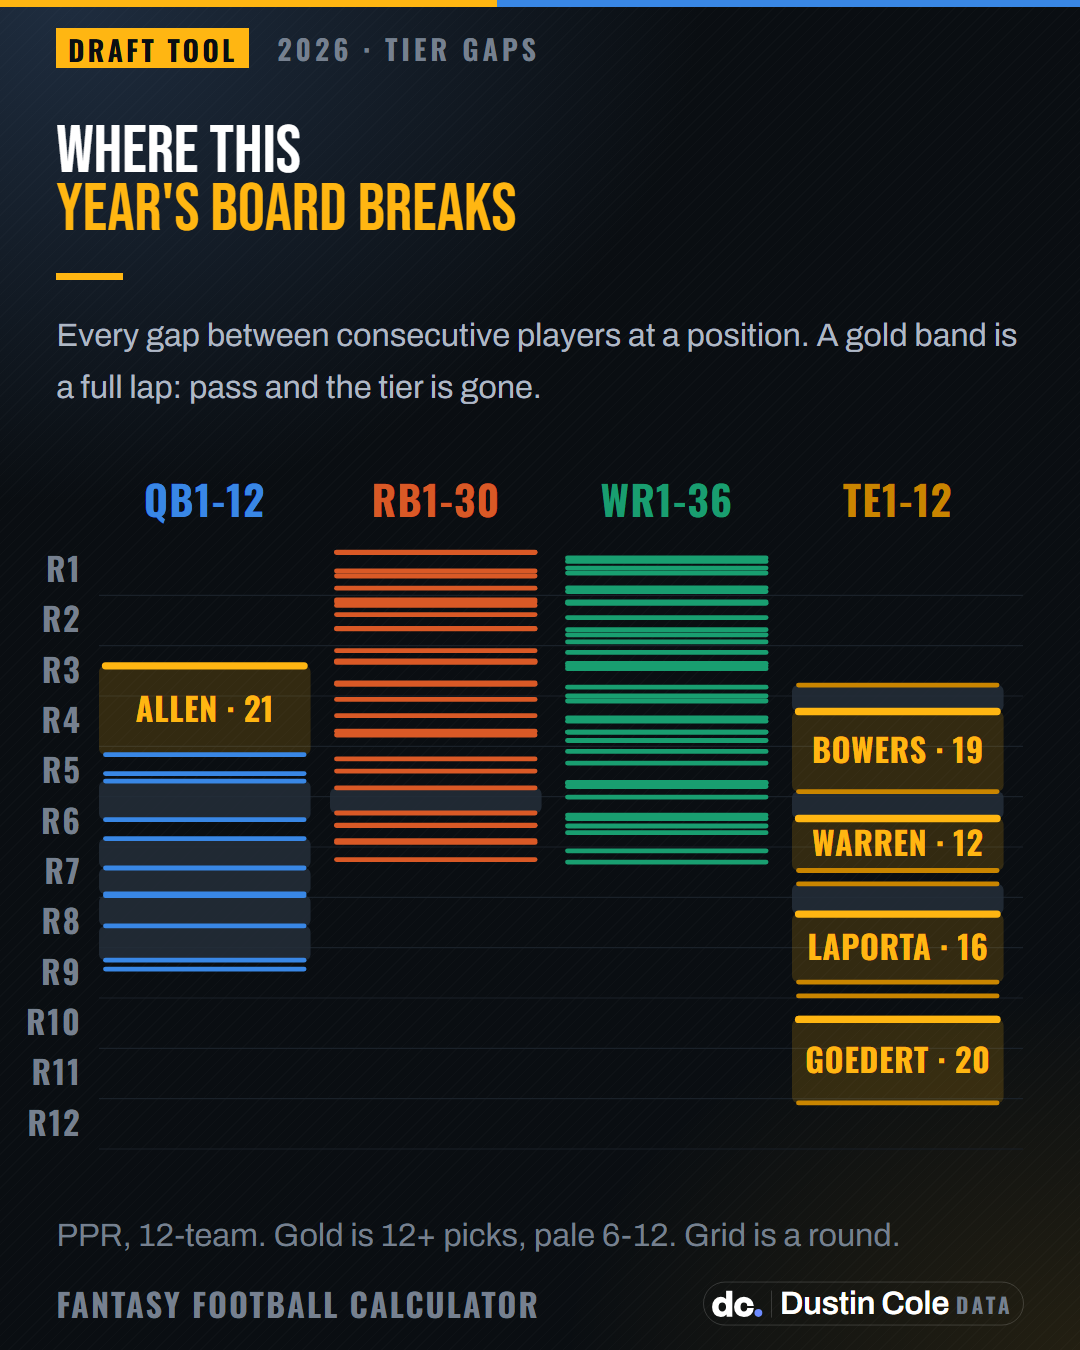
Four columns, one per position, showing every startable player at his 2026 ADP against a grid of draft rounds. Josh Allen has the widest gap after him at 21 picks. Tight end shows 4 cliffs of a full round or more; RB and WR shows none.
11 / 19

WHERE THIS YEAR'S BOARD BREAKS

TOOL
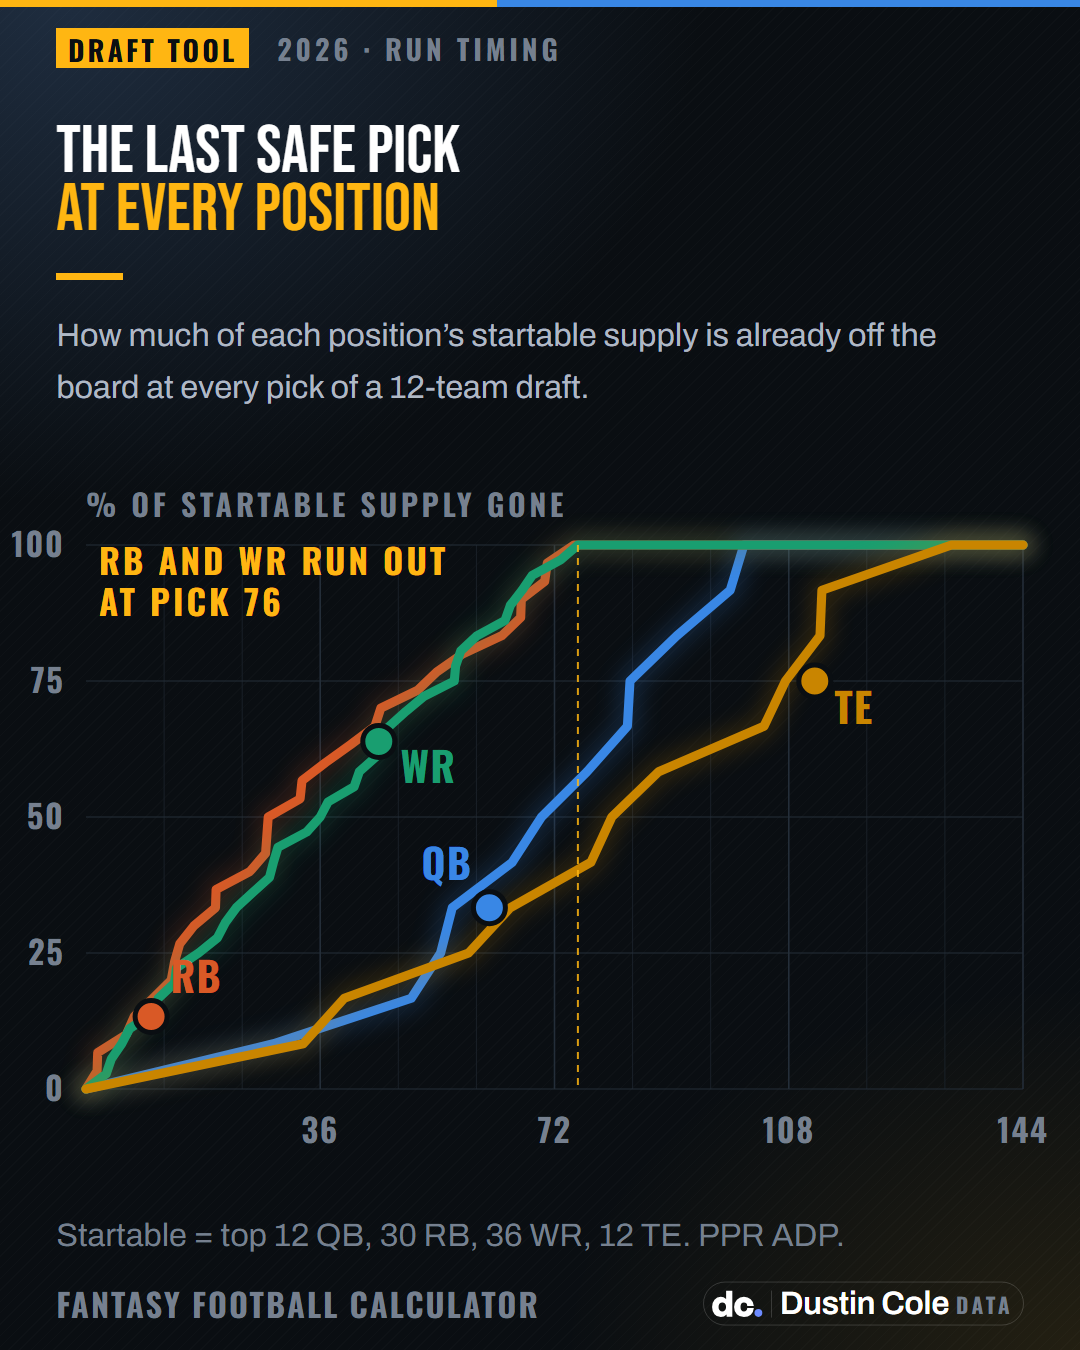
Four cumulative lines showing the share of each position's startable supply drafted by every pick. Half the startable running backs are gone by pick 28 and half the receivers by pick 36, and both positions are empty by pick 76, while half the tight ends are still there at pick 81.
12 / 19

THE LAST SAFE PICK AT EVERY POSITION

TOOL
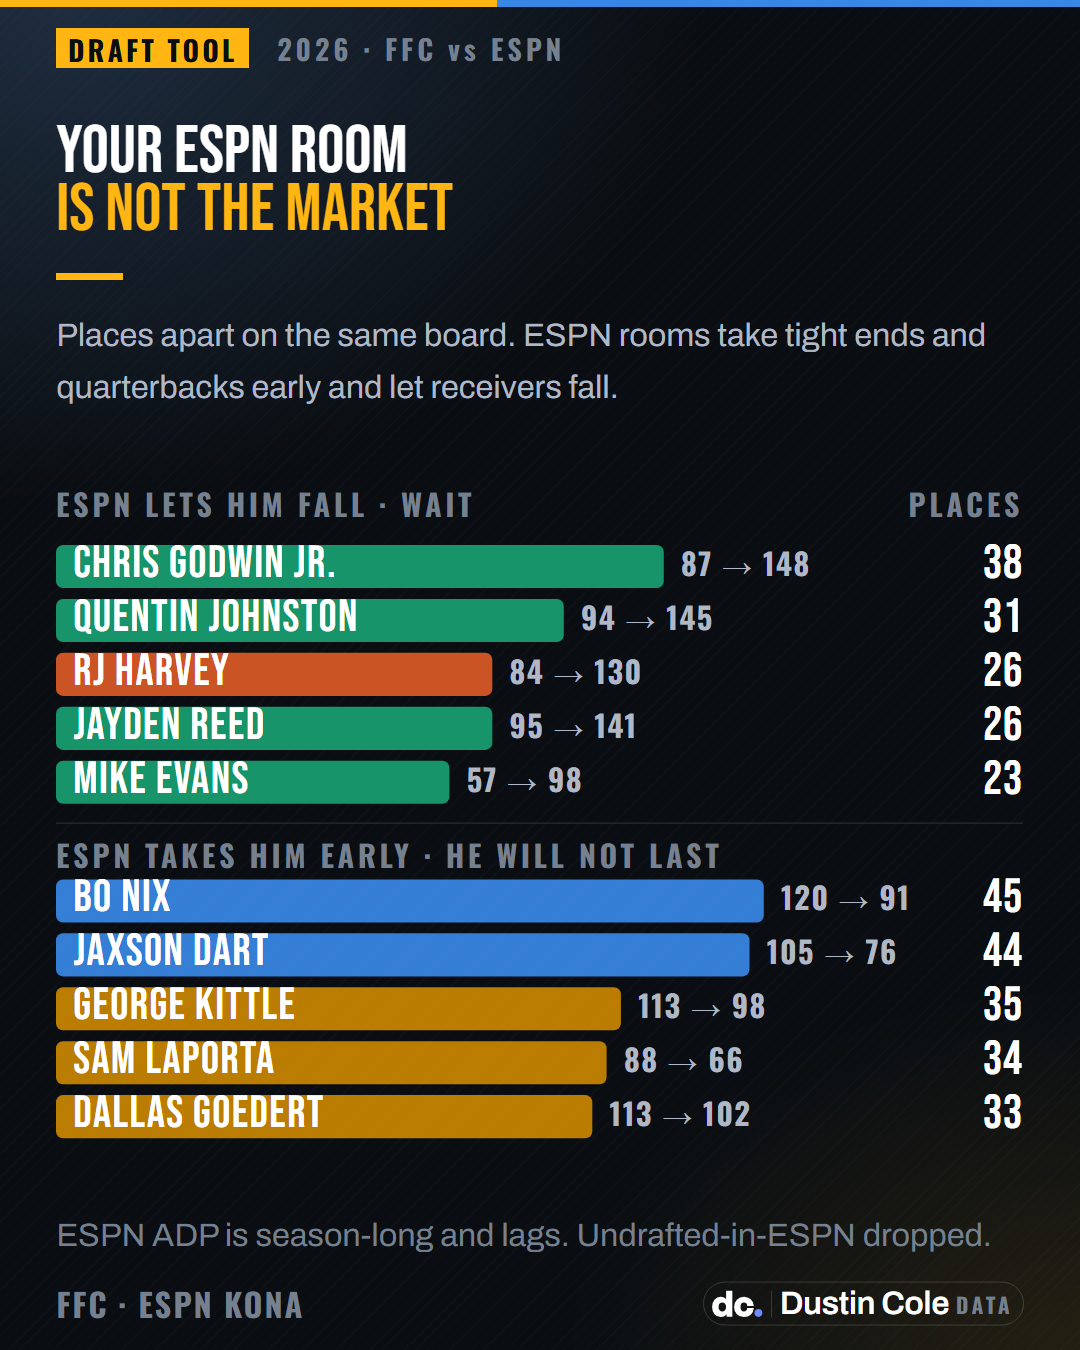
Two bar blocks comparing sharp mock-draft ADP with ESPN ADP for the same players. ESPN lets Chris Godwin Jr. fall 38 places further than the mock market, and takes Bo Nix 45 places earlier. Across the pool ESPN drafts tight ends 24 places early and receivers 8 places late.
13 / 19

YOUR ESPN ROOM IS NOT THE MARKET

TOOLDO NOT POST BEFORE 2026-09-02
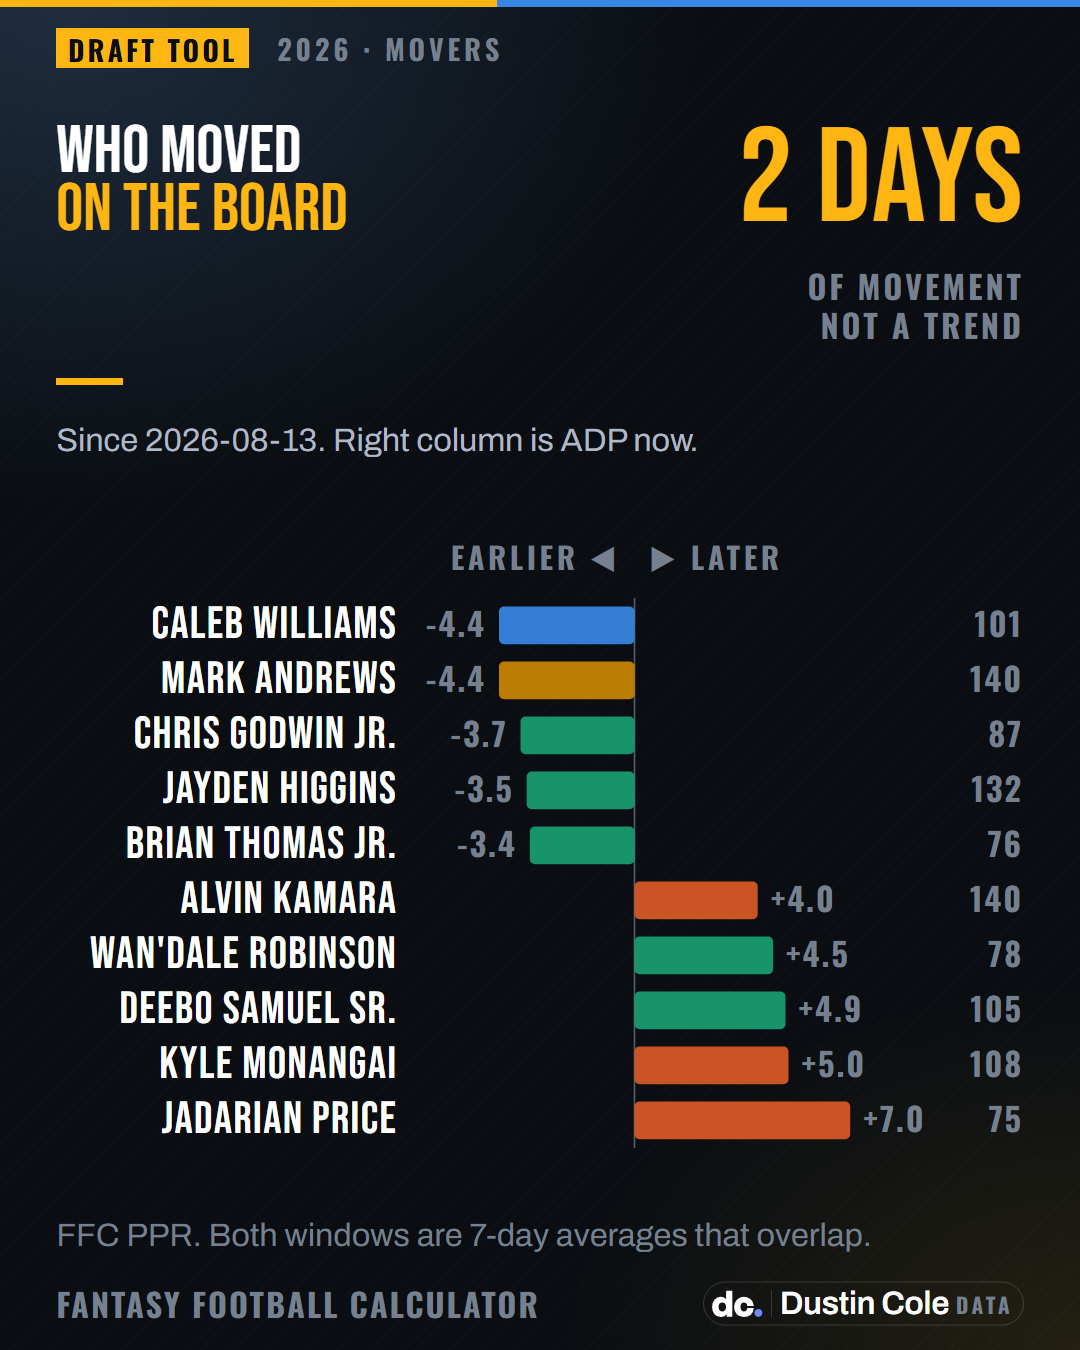
Diverging bars of 2026 ADP change over the only 2 days of snapshots held so far, 2026-08-13 to 2026-08-15. The largest move in either direction is Jadarian Price at +7.0 picks and the median player moved 1.0, too little over too short a window to call a trend.
14 / 19

WHO MOVED ON THE BOARD

TOOL
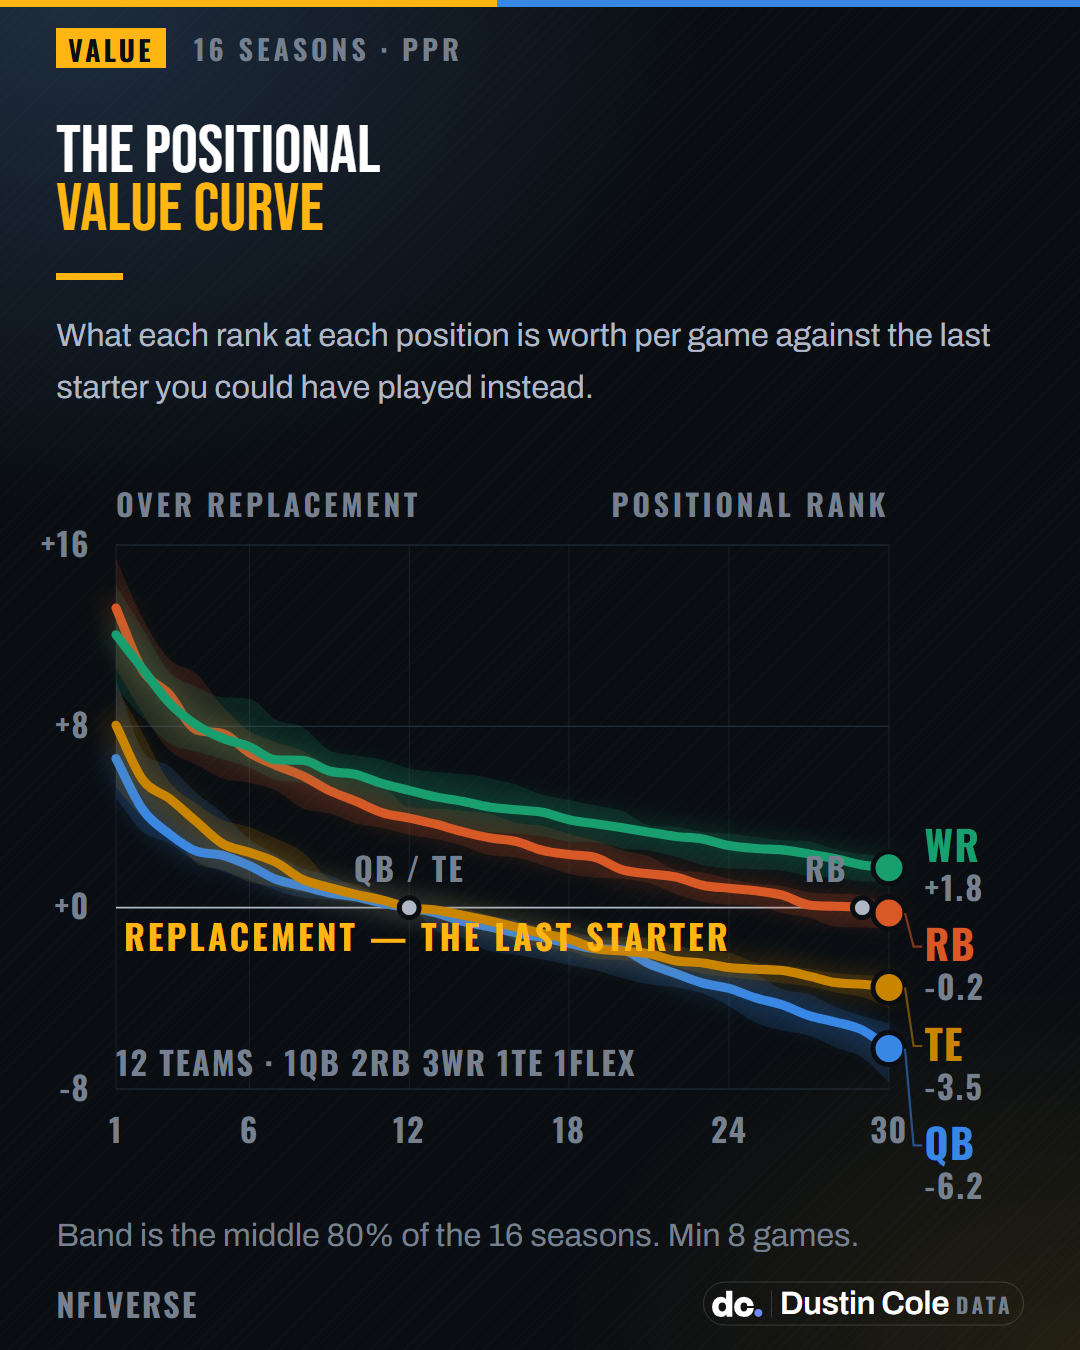
Line chart of points per game over replacement by positional rank, 2010 to 2025. Running back and receiver start near +13.2 and +12.0. By rank 30 the back is at -0.2, just past replacement, and the receiver is still +1.8 above it. Quarterback and tight end start at +6.6 and +8.0, reach replacement at rank 12, and fall to -6.2 and -3.5 by rank 30.
15 / 19

THE POSITIONAL VALUE CURVE

CAPTION · 226 CHARACTERS
A 12-team lineup gets through 12 quarterbacks but 29 backs before it runs out of starters. So the twelfth quarterback is worth nothing over replacement, and the twelfth back is worth 4.0 a game. 16 NFL seasons, 2010-2025. PPR.
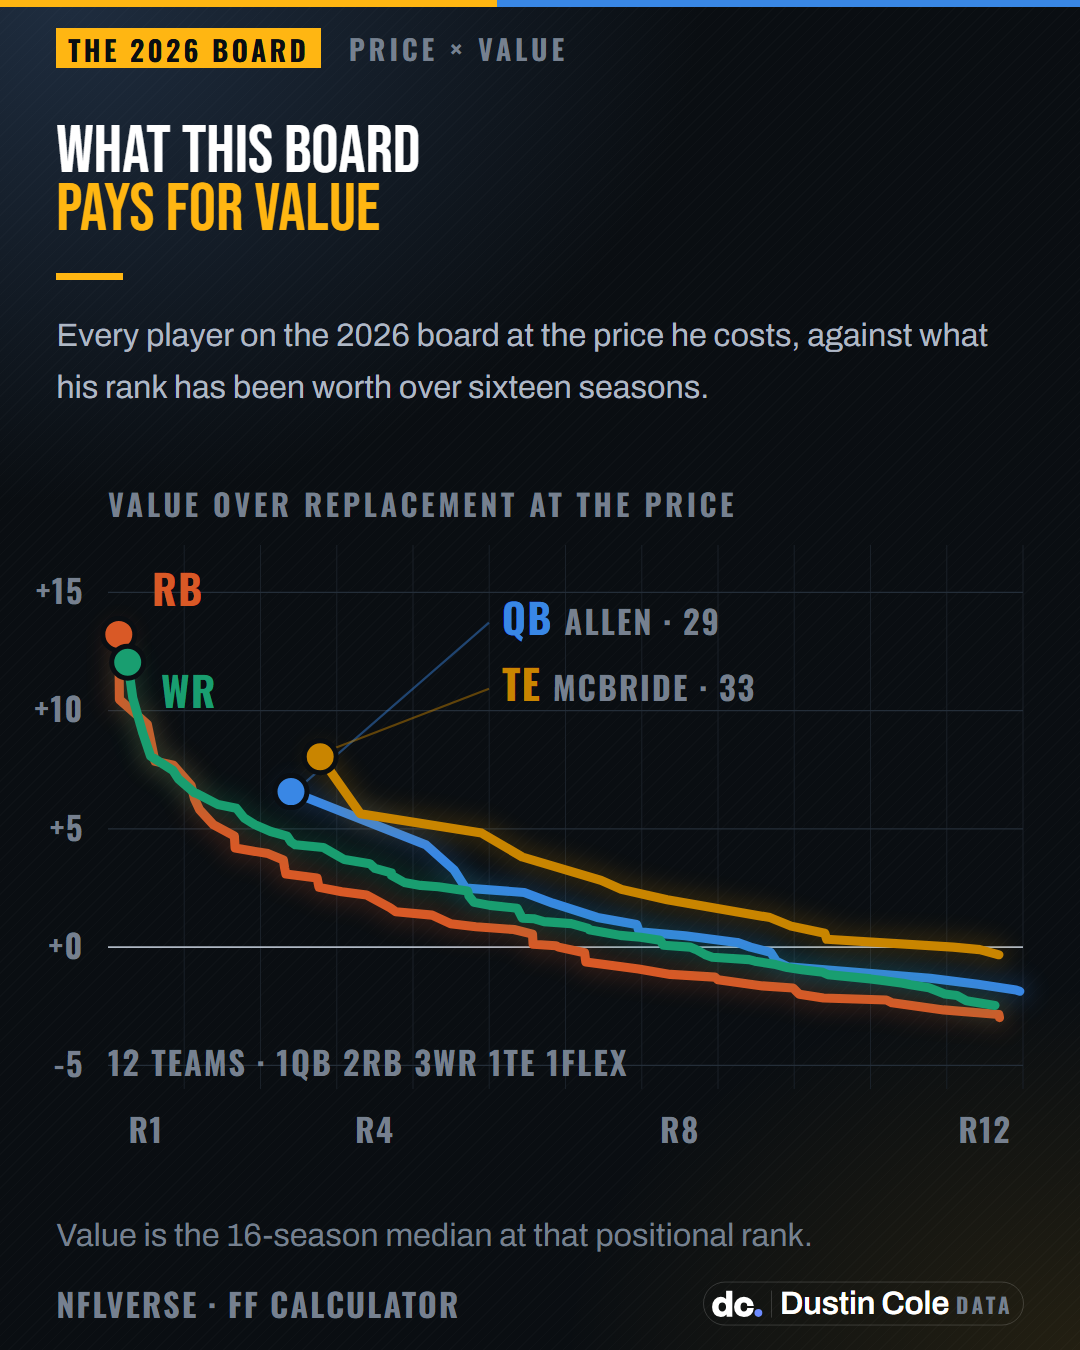
Chart of the 2026 draft board, every player at the pick he costs against what his positional rank has been worth per game over sixteen seasons. The first player at each position: QB Josh Allen at pick 29, worth +6.6; RB Bijan Robinson at pick 2, worth +13.2; WR Puka Nacua at pick 3, worth +12.0; TE Trey McBride at pick 33, worth +8.0. All four lines converge on replacement by the end of round 12.
16 / 19

WHAT THIS BOARD PAYS FOR VALUE

TOOL
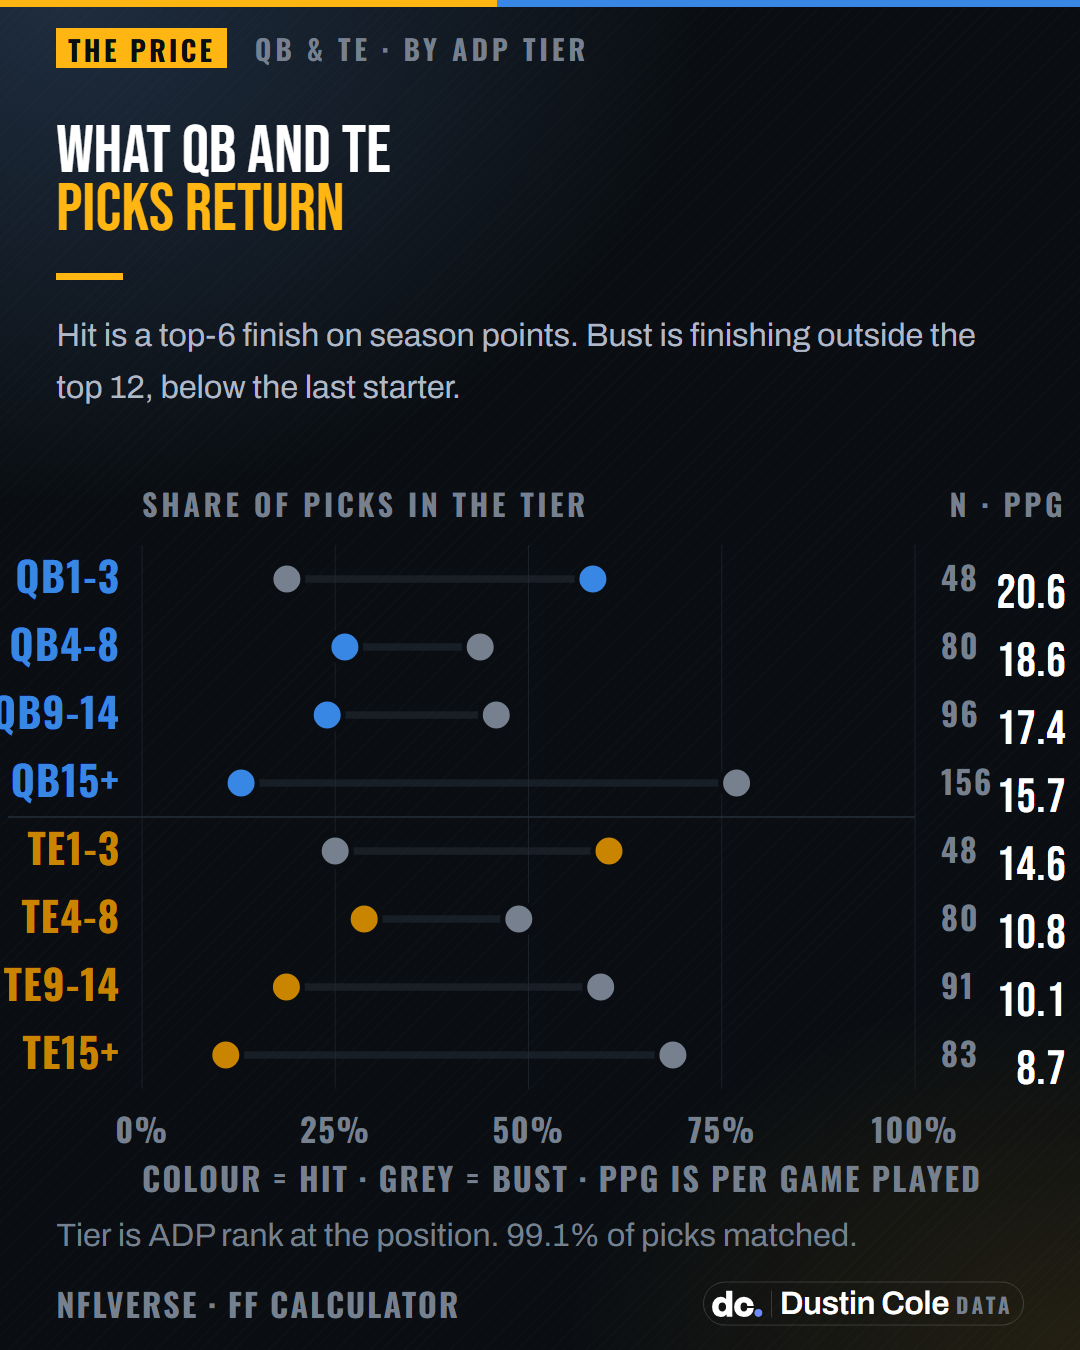
Chart of hit and bust rates for quarterbacks and tight ends by what the draft market charged, 2010 to 2025. The top three quarterbacks hit a top-6 finish 58 percent of the time and the QB4 to QB8 tier only 26 percent, against 24 percent for QB9 to QB14. Tight ends run 60, 29 and 19 percent over the same tiers.
17 / 19

WHAT QB AND TE PICKS RETURN

CAPTION · 173 CHARACTERS
A top-three quarterback finishes top-6 58% of the time. The QB4-8 tier does it 26% and the QB9-14 tier 24%. They bust 44% and 46% of the time. 49,108 mock drafts, 2010-2025.
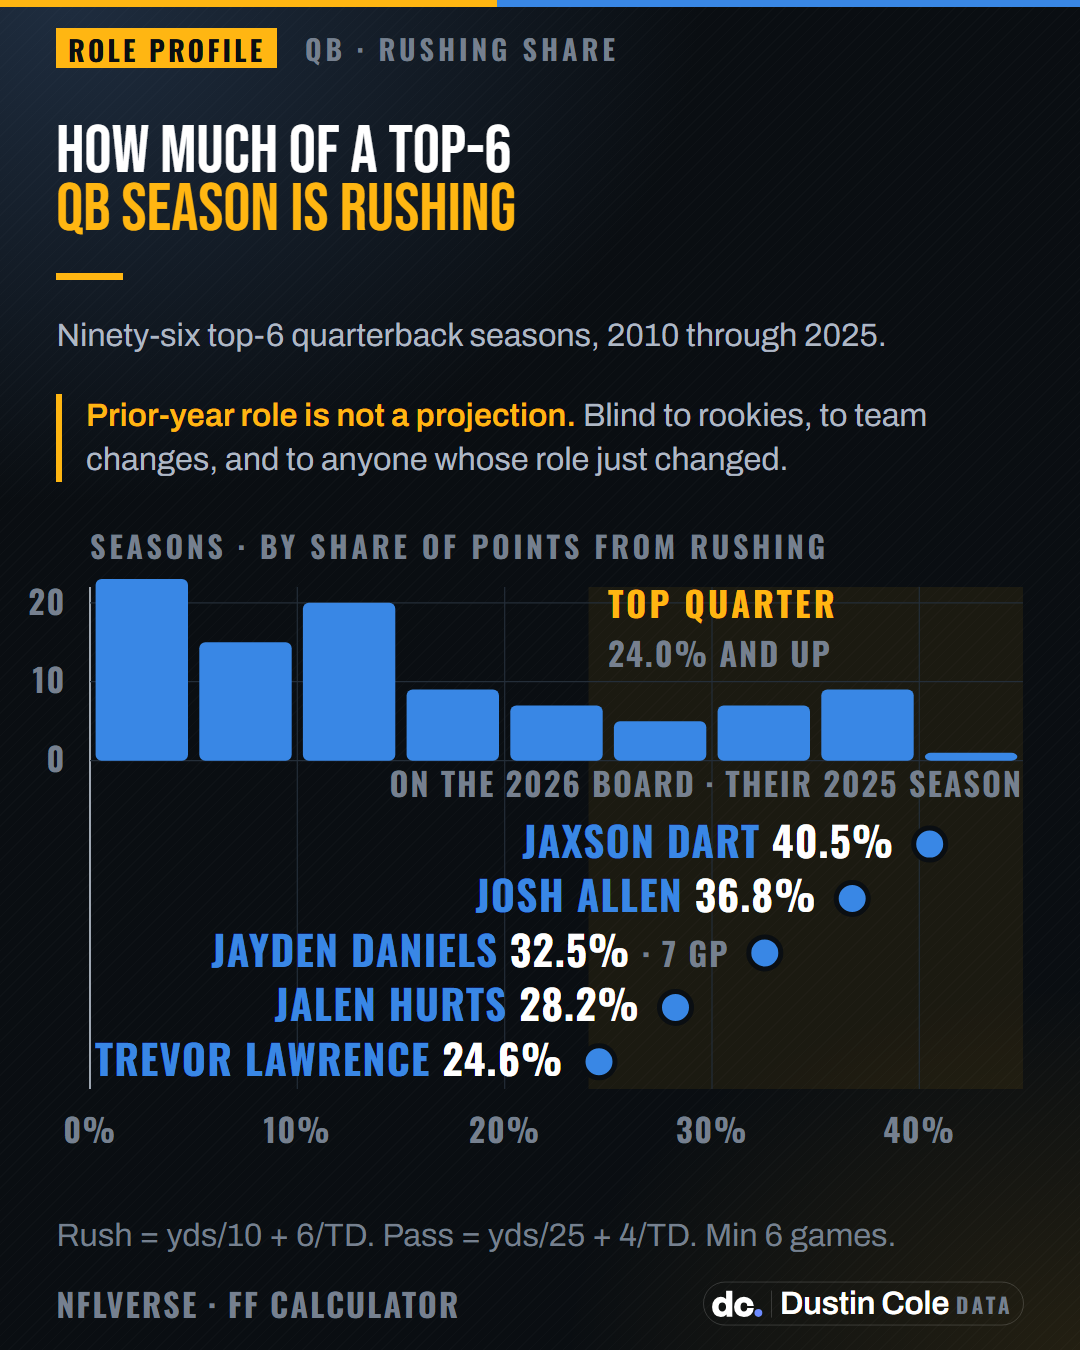
Histogram of how much of a top-6 quarterback season came from rushing, 96 seasons from 2010 to 2025. The median is 12.6% and the top quarter starts at 24.0%, with Jalen Hurts 2024 the highest at 43.9%. Below it, the 5 quarterbacks on the 2026 draft board whose 2025 season cleared that line: Jaxson Dart at 40.5%, Josh Allen at 36.8%, Jayden Daniels at 32.5%, Jalen Hurts at 28.2%, Trevor Lawrence at 24.6%.
18 / 19

HOW MUCH OF A TOP-6 QB SEASON IS RUSHING

CAPTION · 277 CHARACTERS
Half of all top-6 quarterback seasons got under 12.6% of their pass-plus-rush points on the ground. The top quarter got 24.0% or more. Jaxson Dart, Josh Allen, Jayden Daniels, Jalen Hurts and Trevor Lawrence did that in 2025. 2010-2025 seasons; 2026 ADP from 6,466 mock drafts.
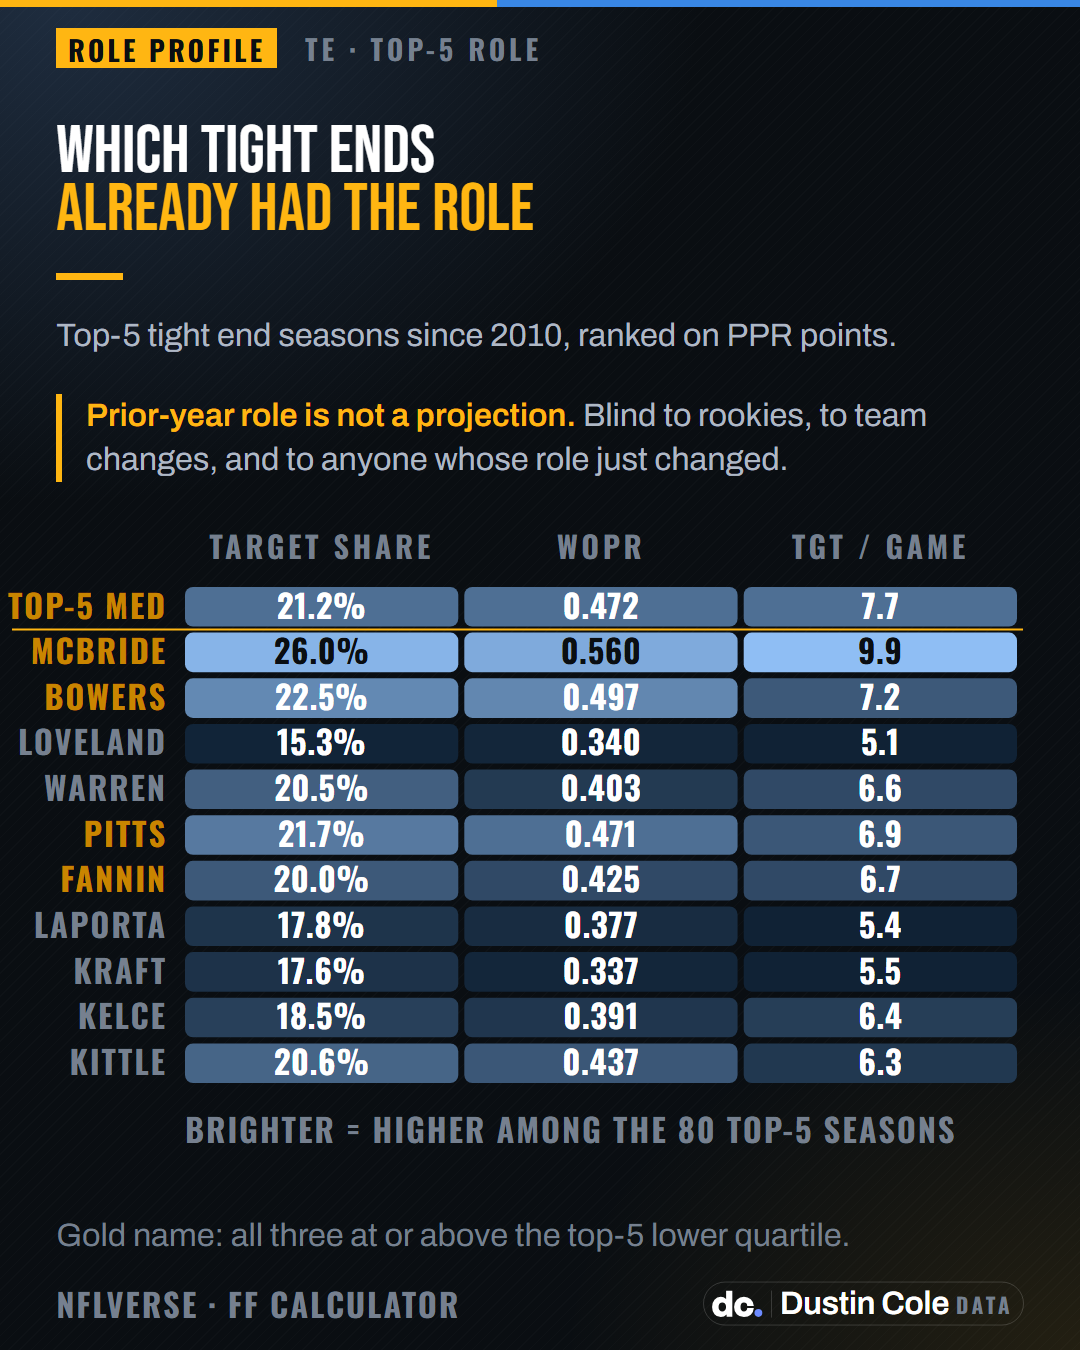
Table of three usage measures for the 10 tight ends drafted earliest in 2026, set against the role of a top-5 tight end season. WOPR is weighted opportunity rating, which combines target share and air-yards share. The top-5 median is a 21.2 percent target share, a WOPR of 0.472 and 7.7 targets a game. Trey McBride ran a 26.0 percent share, a 0.560 WOPR and 9.9 targets a game in 2025. Brock Bowers ran a 22.5 percent share, a 0.497 WOPR and 7.2 targets a game in 2025. Kyle Pitts Sr. ran a 21.7 percent share, a 0.471 WOPR and 6.9 targets a game in 2025. Harold Fannin Jr. ran a 20.0 percent share, a 0.425 WOPR and 6.7 targets a game in 2025.
19 / 19

WHICH TIGHT ENDS ALREADY HAD THE ROLE

CAPTION · 242 CHARACTERS
A top-5 tight end season runs on a 21.2 percent target share, a 0.472 WOPR and 7.7 targets a game. Trey McBride, Brock Bowers, Kyle Pitts Sr. and Harold Fannin Jr. cleared all three in 2025. 2010-2025 seasons; 2026 ADP from 6,466 mock drafts.
FANTASY FOOTBALL CALCULATOR Dustin ColeDATA